The Bernardsville Median Price Problem: Four Sites, Four Different Numbers
September 17, 2026
September 17, 2026
A homeowner thinking about listing this fall pulls up one national portal and sees a median in the high $700,000s. She opens a second tab and sees just over $1 million. A third site quotes $1.54 million. A fourth lands somewhere in between. Same town, same season, four numbers that do not agree with each other.
That is not a data error. It is what happens when a small, high-value town gets measured by tools built for markets that sell hundreds of homes a month. Bernardsville sells a handful. And when a market is that thin, the "median home price" stops being a stable fact and starts being a snapshot of whichever few houses happened to close in whichever few weeks a given site pulled its numbers.
Here is what the same general window of 2026 actually showed across different trackers, measuring different geographic boundaries, different time windows, and in one case, asking price rather than sold price:
| Source and window | Median figure | Sales counted | Days on market |
|---|---|---|---|
| Borough-level tracker, February 2026 | $1.1 million | 4 homes | 125 days |
| Zip-code-level tracker, three months ending May 2026 | $774,000 | 16 homes | 13 days |
| Trailing 12-month tracker, 2026 | $1,050,000 | 86 homes | 35 days |
| Listing-price tracker, July 2026 | $1.54 million (asking, not sold) | not specified | 40 days |
None of these numbers is wrong. They are useful starting points, but if you are a buyer or seller trying to get oriented in Bernardsville, none of them alone tells you what a specific house is actually worth.
The mechanism is simple once you see it. A median is the middle value in a sorted list, or the average of the two middle values when the list has an even number of entries. When the list has 400 entries, one unusual sale may barely nudge it. When the list has 4 entries, one unusual sale can shift it substantially.
Look at what actually closed in Bernardsville in June 2026. In a single month, recorded sales included a 5-bedroom home on Mendham Road that sold for $2.1 million after 154 days on market, a home on Seney Drive that sold for $1,400,512 after just 49 days, a home on Childsworth Avenue that closed at $1.35 million after 17 percent over its asking price, and a home on Thompson Street that sold for $600,000. Two homes on either edge of that price range would put the month's median almost anywhere between $700,000 and $1.4 million depending on which handful of them a tracker happened to sample and when it drew the cutoff.
That is the whole story. A regional brokerage's own March 2026 market report, in its methodology notes, acknowledges this directly: small sample sizes in thin segments of the market can produce statistically extreme swings from one reporting period to the next. Bernardsville is a textbook case. It is not that the data is broken. It is that a town with this few transactions per month was never going to produce a stable single number in the first place.
The gap between two of the figures above is worth sitting with for a moment, because it shows the mechanism in action rather than just in theory. In February 2026, the borough-level tracker counted 4 sales and landed on a $1.1 million median with homes sitting for 125 days. By the three-month window ending in May 2026, the zip-code tracker counted 16 sales, a completely different median of $774,000, and homes moving in just 13 days.
Nothing structural changed about Bernardsville between February and May. What changed was which houses happened to close and how many of them there were to calculate a more stable median. Four sales is not enough to smooth out one large estate transaction or one long-sitting listing. Sixteen sales, spread across a wider zip boundary that includes more condominiums and smaller homes, tells a calmer, faster-moving story. Both are technically accurate. Neither is complete on its own.
If you are getting ready to list, or you are a buyer trying to figure out what a fair offer looks like, the practical takeaway is not to throw out the aggregator numbers. It is to stop treating any single one of them as the answer and start asking a more useful question: what did homes like mine actually sell for, and how quickly?
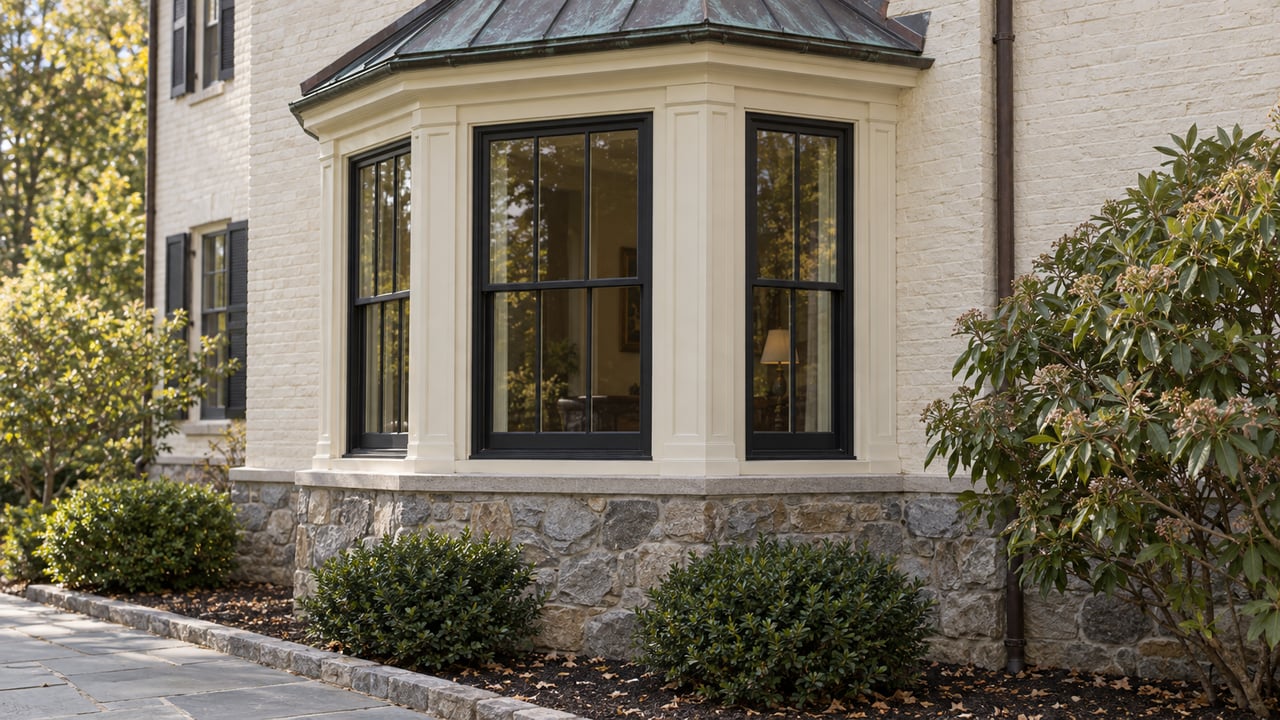
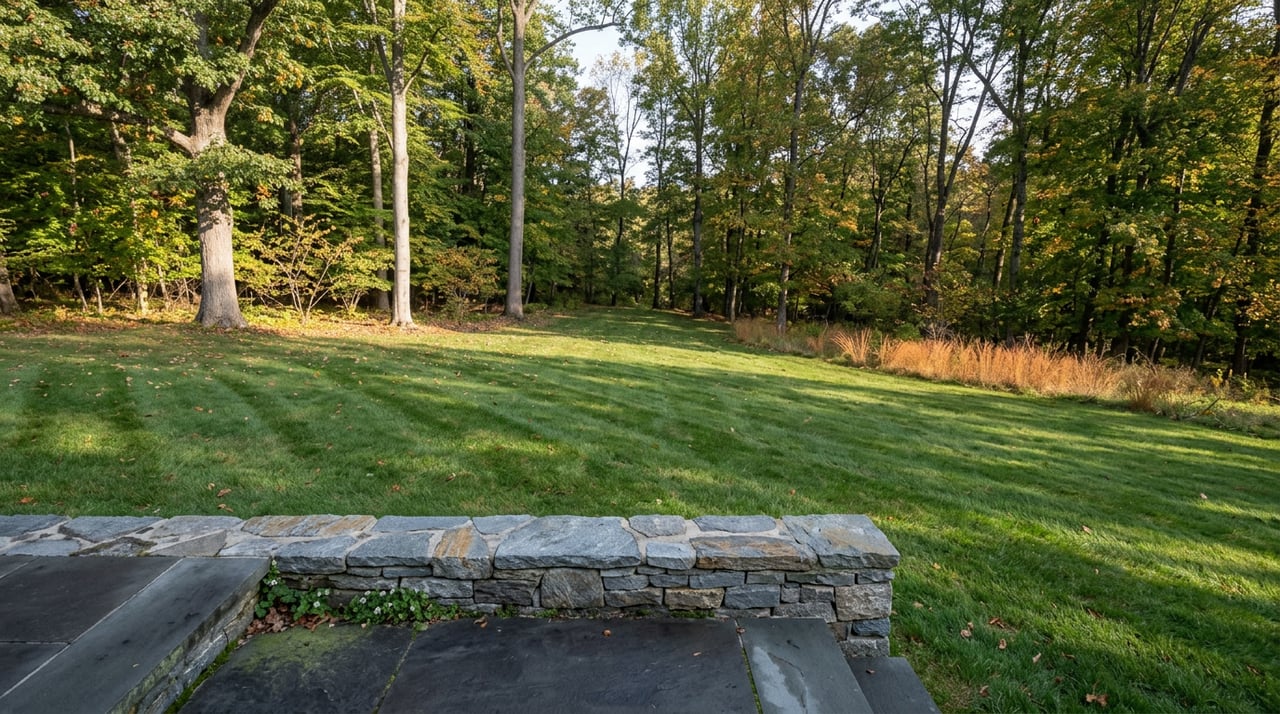
Bernardsville's housing stock does a lot of the work here. The estate-section colonials along Mountain Road and Mendham Road, often sitting on multiple acres with the kind of stonework and mature landscaping the area is known for, behave nothing like the townhomes and smaller homes closer to downtown near the train station. A $2.1 million estate sale and a $600,000 in-town sale in the same month are not two data points on the same curve. They are two different markets that happen to share a zip code.
That is why price per square foot on genuinely comparable properties tends to hold up better than a headline median. It strips out some of the noise created by a single large or unusual sale skewing the whole month. It is also why sale-to-list ratio, house by house, matters more here than it would in a market with hundreds of monthly transactions. In that same June 2026 window, one Bernardsville home sold 22 percent over its asking price while another sold 4 percent under. A town-wide average of those two numbers tells you almost nothing useful about what to expect for a third house.
A few things worth checking before you anchor to any single figure:
If you are cross-shopping Bernardsville against a larger, more liquid market, keep in mind that the volatility itself is information. A town where the median can swing by hundreds of thousands of dollars between two overlapping reporting windows is a town where you cannot shop by headline number alone. You have to look at the actual comparable sale, on the actual comparable street, in the actual season you are buying or selling in.
That is not a knock against Bernardsville. It is simply what a small, desirable, low-turnover market looks like from the outside. The scarcity that makes the numbers noisy is the same scarcity that makes the town appealing to begin with.
Does this mean the portal numbers are inaccurate? Not exactly. Each figure is a correct calculation of whatever it measured. The issue is that a median calculated from a handful of sales is inherently less stable than one calculated from dozens, and Bernardsville's monthly sales volume falls closer to the handful end.
How many homes actually sell in Bernardsville in a typical month? At the borough level, monthly closings have run as low as single digits. Widen the boundary to the surrounding zip code and the count rises into the teens, which is part of why the two levels of geography can tell such different stories in the same season.
What should I look at instead of the median if I am pricing a home? Price per square foot on homes that actually resemble yours in size, condition, and location, paired with a close look at how long truly comparable properties sat before closing. A single town-wide median cannot capture the difference between an estate-section colonial and a downtown townhome, even though both count toward the same statistic.
Karen Tyrell has spent years pricing homes in a market exactly like this one, where the headline number rarely tells the whole story and the real answer comes from knowing which comps actually apply. If you are trying to make sense of what your Bernardsville home is worth in today's market, or what a fair offer looks like on one you are considering, Karen Tyrell offers a free home valuation built on the comps that actually matter for your specific property.
Stay up to date on the latest real estate trends.
Get assistance in determining current property value, crafting a competitive offer, writing and negotiating a contract, and much more. Contact me today.